Technically + Fundamentally Stock Is Very Strong- Keep In Radar
1. **Support and Resistance Levels:**
- The stock chart shows key levels where the stock price tends to reverse direction. The support level is around ₹120-₹140, where the stock finds it difficult to go lower and usually bounces back up. The resistance level is around ₹170-₹175, where the stock struggles to go higher and tends to drop back down. These levels are highlighted with horizontal lines and arrows on the chart.
2. **Trend Lines:**
- The chart shows an ascending trend line, indicating that the stock price has been generally increasing over time. This trend line acts as a dynamic support level, suggesting that the stock is in an overall upward trend.
3. **Volume Analysis:**
- The volume bars at the bottom of the chart represent the number of shares traded. A significant increase in volume, especially the recent big green bar, indicates strong buying interest. High volume on an upward move is a bullish signal.
4. **Indicators:**
- The indicators at the bottom, like the Relative Strength Index (RSI), help in identifying overbought or oversold conditions. The RSI above 70 indicates the stock might be overbought, while below 30 it suggests oversold conditions. The green line in the chart indicates buying strength.
### Fundamental Analysis
1. **Company Overview:**
- INOX WIND LTD is a company that manufactures wind turbines, which are used for generating electricity from wind. This is part of the renewable energy sector, which has been gaining importance.
2. **Market Position:**
- The stock price's upward trend suggests that the company is performing well in the market. Investors have confidence in the company's future prospects, as indicated by the rising stock price.
3. **Recent Developments:**
- The recent spike in volume indicates that there might have been some positive news or developments regarding the company, leading to increased buying activity.
4. **Future Prospects:**
- The chart shows an arrow pointing upwards, indicating that technical analysts expect the stock price to continue its upward trend. This expectation is based on the stock breaking through its resistance level, which could lead to further gains.
Search in ideas for "STRONG BUY"

USDJPY: Received 2 great supportsHello dear friends, what do you think will happen to USDJPY today?
Currently, the USDJPY currency pair is experiencing a good upward momentum:
Regarding the first factor: USDJPY has completely escaped from its previous downward trend and is showing strong buying momentum returning.
Regarding the second factor: After price correction to the Fibonacci 0.5 level, the price has started to rebound, which is a perfect sign indicating strong buying pressure from investors.
With these two factors, we will prioritize a Buy strategy for USDJPY with favorable conditions to take profit at the two main levels of 149.19 and then 154.37.
How about you? What is your opinion on USDJPY?

BUY USDJPY After news price was fall to support now from
support it showing strong buy with formation
hammer strong bullish candle so buy it

No trade zone between 17609 to 17670.In analyzing market trends, it is important to identify potential no-trade zones and formulate appropriate trading strategies that align with one's risk tolerance and overall objectives.
The current price range between 17609 and 17670 has been characterized by strong buying near the lower end and selling near the upper end, indicating the presence of key support and resistance levels. As such, I have decided to exercise caution and wait for a favorable breakout accompanied by a retracement before initiating any buying position. In addition, I am considering buying if the price breaks out of the trendline resistance or falls below the no trading zone along with a retracement , as this may indicate a change in market dynamics and potential opportunities for profit.
These strategies are designed to ensure that I am entering the market at optimal points and are consistent with best practices for risk management.
the OI data suggests we have a strong put writing on 17600 & call writing on 17700 right now,
I'll suggest you stay neutral in such market situation

Nifty -50 trend and Levels expected on 03-01-22 trading Hi,
The Following points may help full to Nifty -50 Option traders – Good Luck
Nifty-50 trend end in last session Neutral in Weekly , Strong Buy in Daily and Natural in 15mint charts.
World market Trends – US – Sell & Europe - Natural
Asian market Trends – Nikkei - Neutral , Hang Seng - Strong Buy & KOSPI - Buy
FII -Bought 575 Cr . in cash , Bought 884 Cr in Index Future & in Index Option Sold -3238 Cr on 31-12-21
DII- Bought 1166 Cr. on 31-12-21
SGX – Open flat and currently trading moving down wards
Nifty50 Future – Open flat and currently trading moving down wards
The market may open flat or gap down and according to sustains of support or resistance levels as bellow mentioned.
The major support zone 17184 crossed bellow and sustained then fall down to17101,16999,16833.
The major resistance zone 17267 crossed above and sustained then raise up to 17384, 17534,17639.

It seems Bulls & Bears are confused - seeking mentoring help!NIFTY 50 EOD ANALYSIS 30-11-21
In this post, I talk about the analysis for the day and the trading range for tomorrow. The video discusses with the help of the charts how the indices as well as leading stocks performed during the day and their likely play tomorrow.
O 17051.15
H 17324.65
L 16931.40
C 16983.20
EOD +27.60 points / +0.16%
India VIX 21.17
SGX Nifty 29-11-21 @ 1905h = +23 points
FII DII = -95 Crores
CHART BASED CONCLUSIONS using 5 Minutes Chart
Nifty opened almost with O=L and then rallied 250+ points as if it was a real bull market beating all the expectations.
And then came the unexpected fall of 300+ points. It took support from just below 17000 and then made an attempt to test 17200 and that failed miserably as it fell again 250+ points taking FTSE as the cue.
With this, it erased all the gains made during the day and many scrips have been hammered - the candles of all leading scrips also confirm the same if one looks at the daily chart.
On the daily charts, today’s candle appears almost the reverse of 29-11, yesterday.
Even though Nifty ended below 17000, it has made a higher high and a higher low.
NIFTY WEIGHT LIFTERS & DRAGGERS
Top 5 Lifters contributed = 67
Top 5 Draggers contributed = 99
Net = -32
POSITIVES
Infosys and TCS have helped Nifty stay in some sort of balance. They have been ably helped by the Bajaj twins who have now formed the habit of being the lifters or the draggers.
The opening hour play indicates that there is strong buying support available around the 17000-17050 area. This could prove to be crucial.
NEGATIVES
Reliance and HDFC were manly responsible for the negativity and that then spread on to the other leaders.
Kotak Bank a lifter yesterday and made a U-turn today and is a dragger today. This is indeed confusing.
Bank Nifty failed to close above 36000 and Nifty failed to close above 17000.
TRADING RANGE FOR 01 Dec 21
Nifty Support = 16500-16700
Nifty Resistance = 17100 and above until 17500 is taken out on a closing basis.
Bank Nifty Support = 35000-35200
Bank Nifty Resistance = 36000-36200-500-800
INSIGHTS / OBSERVATIONS
A strong up move in the first hour until a few minutes thereafter took Nifty past 17320 and just as it appeared that we may belatedly follow the global cues, a relentless fall of 325+ points would have trapped many traders on the wrong side.
This abrupt fall could be attributable to the opportunistic statement made by the CEO Moderna stating that vaccines may not work on the new variant. Should CEOs make such untested conclusive remarks?
Exactly after a quarter, Nifty ended the day below 17000. The last such close was on 30-8-21. Looks like Maths wizards are at it again!
Even though the Nifty spot was going down in the last half an hour and it made a low at 16931, the Nifty Future was managed in such a way that it held the low of 17000. The more I observe, the more I find good management skills being applied here.
Today FIIs have sold for more than 5000 Crores and DIIs have given a befitting response by buying in excess of 5000 Crores. Based on my tracking, such massive buying by DIIs has happened after quite a few weeks - 2 months plus. Could this be the game changer act?
What do you feel about this?
Here is the video link --
Thank you, and Happy Money Making!
Umesh
30-11--21
NOTE --
This write-up is not a prediction mechanism for the movement of Indices in the Indian markets as the markets are unpredictable in nature. I may refer to many data points in the article but I do not base my view on any of these standalone. In fact, I prefer to react to the price moves than predict the price moves. I also do not review Open Interest. Whatever data points I am using, are all stated in the article. The article title, as well as its contents, can at best be stated as --- This Is How I Read Nifty. I hope I have been able to set the expectations right.
---

ALGORAND Cryptocurrency (ALGOUSDT) BULLISH OR BEARISH?ALGORAND Cryptocurrency (ALGOUSDT) for swing - Bullish or Bears?
Hi guys, yet again with a new hyped, crypto altcoin; ALGORAND (ALGOUSDT) with a simple price action and chart pattern analysis.
The negative news has halted the crypto market which has resulted in panic. The sentiment analysis is filled with Fear (33% at the time of posting this video which has been better from last few days). The Algorand has already been in news due to it's DeFi and interoperability. It is at make or break situation and now in a state of consolidation and therefore will come back to retest its previous levels if it makes a move. This will result in an opportunity for either good buy or good sell for positional or swing traders.
The analysis is for 2 hour time frame which has so many movements in itself listed below :-
1. Constantly facing resistance from trend line and therefore it has become weak since the same trend line has been tested for 5 times now! It will definitely come to retest it again and can result in a good move upside. It can gain good momentum (10-12%) in the next few days.
2. A constant support level (strong buying) as shown. Sellers have faced immediate resistance trying to push support levels but failed miserable which means it becomes undervalued at those levels and price moves up very fast. It has tested the support 4 times so it is also becoming weak.
3. It has made double bottom also(W pattern - bullish sign) and gave a break out after retest. But eventually resulted in breakdown, therefore the bullish momentum is pending and can continue in next trading sessions.
4. Volume Profile Fixed Ranged (VPFR) indicates the traded volume amount over a specified period. It works best in higher time frames. It is quite visible when the most volume got traded (yesterday), it resulted in a meltdown. Now this indicates a strong sellers zone and the buyers will have to match seller's frequency if the coin goes uptrend. Therefore, it is the target expected from this point.
BOTH TARGET ARE LISTED BUT I AM MORE INCLINED TOWARDS BULLISH NATURE :-
1. BUY - If it breaks 50-EMA (green line) with good momentum (around 1.8600), Target will be 2.000 with stop loss of 1.7300
2. SELL - If it takes resistance from 50-EMA or 200-EMA, target can be 1.5850 with stop loss above the 50 or 200 EMA (which ever is far!)

Lupin Buy Side Strong Confirmation Area of ConfluenceBuy above 1010 On Day Closing Basis Target 1059/1130 Sl 985. Levels of 990 are important historical S&R... Also broke Symmetrical triangle on Daily basis. Crossing 1.27 Fibo levels makes entry for 1.618 in Lupin. Overall A strong buy At Area of Confluence.
Disclaimer: These are my personal views. I am not responsible for any kind of profit or loss. Trade on your own risk.

AFTER CONSOLIDATION OF FIVE DAYS BNF MOVED UP WHAT NEXT SEE !!Hi Traders,
1. Yesterday I posted neither bnf nor nifty. In fact, There was not much change in the structure of both indexes, therefore, I just updated my ideas with an update. Hope you all would have seen it. Those missed either They do not follow me or not configured the right side idea button with your favorite author's notifications. let us compare the statements of the previous blog with price action. In point N0. 1 of the trading plans I mentioned is quoting for your consideration" As you have seen the taken-out condition is not fully activated for a downside trade. So I would like to see the upper zone condition to get activated for long trades. And zone is to watch is the pink dotted line with a solid green line. I showed a green arrow on the zone which has to be watched." You can see I talked about pink dotted with a green line as a zone for the watch in terms of the condition mentioned for this zone. Ideally, the taken-out condition is met only in 15 min time frame, not in 1hr.
2. Since the gap between the pink solid line to the upper end of the zone is big so one can not wait for the trade to get a green arrow condition to get activated. Especially when range bound trade is going for the last 5 sessions show in fig as vertical red line as a breaker. As I mentioned the condition of taken out for complete zone, not Pink color dotted line. Many traders were looking for the pink line to apply this condition. fortunately, it satisfied with both time frames. They must be aggressive traders. There is no harm being aggressive attitude in stock else you know how to time your trade. This post is going to be lengthy because today I have to clear the misconception of taken out condition among traders. So bear with this post. Writing a lengthy post is also time-consuming but for the sake of all traders, I have to write.
3. See I mentioned in point no. 2 of trading plan " If this zone is taken out in 15 min time frame then aggressive traders can take long with the stop loss of buying set up in a lower time frame of 5 Min. For non-aggressive trades, both conditions should be fulfilled. But In trading, nothing is shot sure even 1-hour condition gets fulfilled, you need to find set up on 5 min time frame to take longs with setup stop loss." Today two followers were trading today in bnf but with a different understanding of my points. The first talk about the one who loses 930/- what he wrote was looking upset and tensioned in his trade whereas second who earned 400 pts was calm and confident in his trade. You can yourself Judge as I am quoting their statements to understand how trading is done with conditions I mentioned in every post. "kiran2k7
4 hours ago
@kiran2k7, I have taken 2nd JUL 10500 CE @ 34.95. let's see how it rides." Here he bought 10500 ce . kiran2k7
4 hours ago
@yvatsji - the condition is of the upper green line is taken out in 15 min time frame then the price will move to the red dotted line 10,549.
Looks like it just was taken out. Now can we enter long to target the red dotted line?" Here he is expecting a reward. The condition has been taken out or not I will discuss the nifty post. "kiran2k7
3 hours ago
Sometimes I feel like, after I bought it, it drops down.
It may be my psychology, also I feel that somebody trying to pull me down." Here he is depressed with the Volatility of price. " kiran2k7
3 hours ago
@kiran2k7, It's easy to lose in the market. Right now, my position is still open with 975 Qty @34.95 - Now trading at 25.9 with a loss of 8k." Here repenting on his decision. "kiran2k7
an hour ago
Exited my intraday position with a loss of 930/- after holding it for 3 Hrs.
Looks like the price is moving around the Greenline. Good that I have not made a huge loss on this entry.
The importance of this position is having the patience to hold the position until the end of the day to minimize the loss.
I'm posting this to help others." Here Happy with small loss at one point 8k. If you all see and in a chronological manner. You will find He is unable to handle the options and still playing that instrument. Second, he read the chart and my instruction in an aggressive way and took his trade in an aggressive manner. Third, there is a concept to time your trade, he does not know. Fourth unable to put stop loss which is necessary for every trade. I write with every condition time your trade on a lower time frame where you will get your stop loss and entry point. But he is unable to understand. I know many traders are unable to understand but still, they trade.
4. See the case of the second follower who understood the market first by doing paper trades with perfectly following my instructions and result, you can feel the confidence and calmness in his trade is quoting for your consideration. He explained the trade logically but the first one did not. "akhil313
3 hours ago
@yvatsji
Sir, I took a trade after a long time(due to the range-bound market) since I saw a good movement from buyers today and they were also holding the ground. The pullbacks in 15 mnts were very weak, buyers candles were very strong, retraced fully with power, and got confidence when I saw a very strong buy candle in 1 mnt time frame which crossed the pink line. Then I checked whether there is a similar pullback by sellers, but there was none. So I took the trade with Entry - 21600 and SL- 21400 and TP - 21800, below the green line. And the trade worked perfectly and hit the TP.
Thank you, sir, and god, bless for teaching us" You can see how he took his trade. The moral of comparison is that the stock market rewards those who show patience and aggression both in a balanced manner. If there is little imbalance in these two, you can not earn from the market. Both examples prove my point. Rest you people decide how you want to react in your trading.
5. Now come to today trade See price was consolidating In range for the last five days and both sides condition was in fig. You can see a lower solid pink line supported in precious days that you can see I marked in the previous posts too. And posting below your consideration. when In the morning First-hour candle took support here and reached green resistance. I took my entry consulting with lower time frames With the stop loss of second candle low and booked at upper green resistance. Today trade was clear and simple. No, if buts. Though you people will think when upper side condition is not met Though I took the long side trade. By simple logic of five-day consolidation with First hr buying by smart money. Since this type of circumstance came across first-time since I wrote my blogs so you are not aware of this. And without a practical example, I can not share how one can trade when conditions have not met both sides. Hope this concept is clear now. Next time if you face this sort of situation, You know how to handle it.
Trade plan for next day,
1. Since the condition of taking out is fulfilled in a one-time frame 15 min so I will wait for 1 hr time frame to full fill this then I will be taking longs. For new readers Here is taken out condition:- "Taken out condition works in the two-time frame combination for daily( 4 hr + 1 day) analysis. Similarly, work for lower time frames is also a two-time frame combination. For intraday trades 1 hr with 15 min. For taken out condition price has to complete in both time frames. Aggressive traders can take that side position in a lower time frame with the stop loss of breached candle low. In both the time frames given line is breached by a candle that candle high is to be breached by next candle and close should be above the previously breached candle. This is how taken out condition is being implemented. "
2. I made a red arrow on the green line that line can change the structure of the long side to downside If taken out in Both time frames. Those who are positional long should square off long if taken out in 15 min time frame.
3. The same green arrow shows an upper target if the starting of the arrow on green resistance takes out in 1 hr time frame then the green dotted line will be the target. The rest price will decide.
YOGESH VATS
Disclaimer:- All trading positions should be taken from consulting your financial planner. This study is for educational purposes only.

SRT : LONG ACTIVE / STRONG MONTHLY PICKBUY ACTIVE NOW
560 TO 575 BUY RANGE
SL DEEP
AS MENTIONED
POTENTIAL TARGETS
624/663/700/740/777/823
CAN BE A STRONG BUY FOR LONG TERM POTENTIAL 40% RETURNS FROM HERE SL 415

A clear short term buy on Netflix.Netflix is in a buy zone with the stock crossing the 200 DMA in the last week. The stock has taken support at 50 DMA twice in the brief upside movement that the stock has been doing from past few weeks. We recommend a strong buy at the current levels @ 339.20 and Targets at 384.60 ( Strong Resistance ) with a stoploss at 320 levels.

JSL Stock View | Trade Nivesh Most metal shares were trading in the positive zone in Friday's morning session. Jindal Stainless (Hisar) (up 2.16 per cent), NMDC (up 1.94 per cent), Hindalco Industries (up 1.78 per cent) and National Aluminium Company (up 1.04 per cent) too were trading higher. JSL create buy volume at 38.85 again create strong buy 38.95 after that create very strong buy 39.20

KAJARIA CERAMICS CHART PATTERN ANALYSISKajaria ceramics has formed two pattern which are very strong and bullish patterns in nature.
The only difference is the time-frame
It managed to form "Double Bottom" on daily chart(strong buy)
It managed to form "Ascending Triangle Pattern" on weekly chart(positional long call)
I am happy to see that the price has broken out of both these patterns in the same week
Plus momentum indicators such as "RSI" and "MACD" have given confirmation and have gained strenth
Stock is now bouncing constantly from its moving average
We saw price break above 740 for the first time(on closing basis) since 14 month(0ct-16) on weekly chart
WHAT DOES THIS INFORMATION TELLS US?
"It tells us that the price is about to enter in a new uptrend because previously at these level "DEMAND WAS MET BY SUPPLY"(bears were in command from 744 levels)
and now "(GREATER)DEMAND>SUPPLY" so we have eventually seen the stock breakout from 740(bulls are fighting hard)
Now at this level bears will still fight and will try to set a trap but since the level is broken we will see short covering in the market which will pump up the market.
TRADE VIEW
SHORT TERM TRADERS....
BUY @750
STOP @735
TARGET @770-790(WILL TAKE TIME)
LONG-TERM TRADERS
BUY @750
STOP @700
TARGET @790-815-835(NEXT TWO TO THREE MONTHS)
!!HAPPY TRADING!!
!!PLEASE LEAVE A LIKE COMMENT BELOW!!
!!WATCH OUT FOR BTST/STBT IDEAS @ 3:15!!
!!EVERYDAY!!
!!SOON GOING TO START 9:20 CALLS IN THE MORNING!!
!!EDUCATIONAL IDEAS ONLY ON SAT/SUN!!
FOR BUSINESS PURPOSE CONTACT
MANAV KHANDELWAL bfm,CMT.level-2,Cfa level-1(candidate)
TECHNICAL ANALYST
FULL TIME TRADER
manavtechresereach@gmail.com
FOR PREMIUM CALLS
For tech queries please mail me and questions will be answered by weekends....

#UPLUPL Ltd - Monthly Chart Analysis
Current Price: ₹647.50 (+7.25%)
Open: ₹609.80 | High: ₹658.25 | Low: ₹594.45 | Close: ₹647.50
Key Observations
Strong Monthly Breakout: The stock has given a strong bullish close above previous resistance near ₹570-600.
Reclaiming Higher Levels: After a prolonged downtrend, UPL is now showing strong buying interest.
Next Resistance: ₹700-720 zone, which acted as resistance in the past.
Support Zone: ₹570 (recent breakout level), which may act as a retest area if the stock pulls back.
Momentum & Outlook
Bullish Bias: As long as the stock holds above ₹600, the uptrend remains intact.
Volume Confirmation Needed: If backed by strong volumes, this breakout could lead to a sustained rally.
Caution if Below ₹570: A breakdown below ₹570 would invalidate the bullish structure.

Strong Bullish Momentum with RSI Breakout📈 Stock: BSE Ltd (NSE:BSE)
🔍 Closing Price: 5631
📊 Patterns: Bullish Engulfing, Bullish Marubozu, Strong Bullish Candle
📉 Technical Signal: RSI Breakout
Key Observations:
✅ Bullish Engulfing & Marubozu indicate strong buying pressure.
✅ RSI Breakout, signaling increased bullish momentum.
✅ Strong price action with a decisive close near the high.
Key Levels to Watch:
🔹 Support Zones: 5295 – 6009 – 6345
🔹 Resistance Zones: 5295 – 4960 – 4770
Trading Plan:
📌 Sustaining above 5675, potential upside towards 6009 and 6345.
📌 Below 5295, a pullback towards 4960 could be possible.

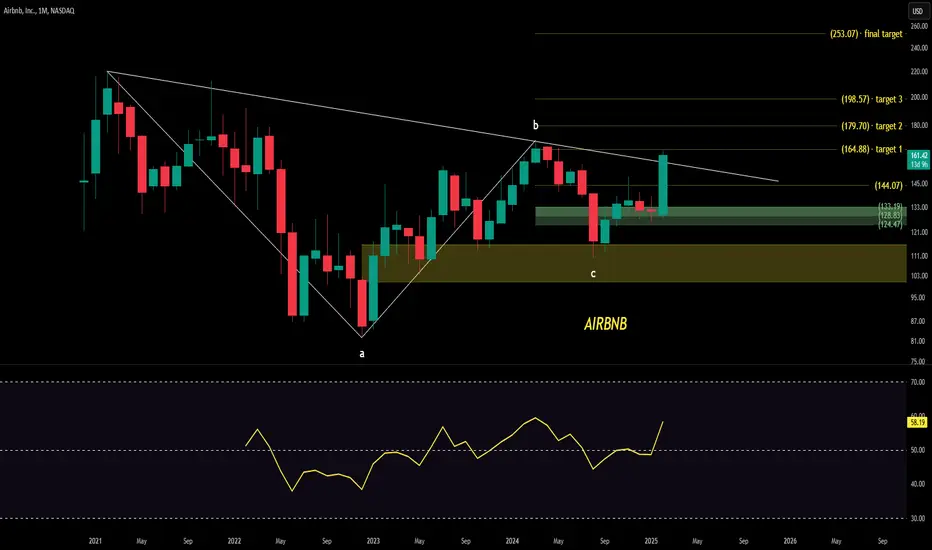
ready to expand AIRBNB (NASDAQ)Stock Chart Analysis for Airbnb, Inc. (NASDAQ: ABNB) on a Monthly Timeframe
Relative Strength Index (RSI)
RSI Value: 58.19
Interpretation: The RSI indicates that the stock is in a neutral to slightly bullish territory. RSI values above 70 indicate an overbought condition, while values below 30 indicate an oversold condition. With a current RSI of 58.19, the stock is neither overbought nor oversold.
Volume
Recent Volume: 67.42 million
Interpretation: The recent increase in volume suggests strong buying interest and higher trading activity. A significant increase in volume often indicates strong investor interest and can signal the strength of price movements.
Key Support and Resistance Levels
Support Levels:
124.47 USD
128.83 USD
133.19 USD
Targets Levels:
144.07 USD
164.88 USD (Target 1)
179.70 USD (Target 2)
198.57 USD (Target 3)
253.07 USD (Final Target)
Trend Analysis
Trendline: The chart shows a descending triangle pattern with a breakout above the upper trend line.
Candlestick Patterns: The recent candlestick shows a significant upward movement with increased volume, indicating strong bullish momentum.
Summary
The stock has recently broken above several resistance levels and is approaching the next resistance at 144.07 USD. The RSI value suggests a neutral to slightly bullish stance, and the increase in volume indicates strong investor interest. The breakout above the descending trendline indicates a potential reversal of the previous downtrend.
Disclaimer: This analysis is for informational purposes only and should not be considered as financial advice. I am not a SEBI registered analyst. Please consult with a certified financial advisor before making any investment decisions.
CHOLAFIN – Breakout with Strong Momentum #CHOLAFIN – Breakout with Strong Momentum 🚀
✅ Breakout Alert! CHOLAFIN has been consolidating for the past few months and has finally broken out this week on above-average volume, signaling strong buying interest.
Key Technical Highlights:
Range Breakout: The stock has decisively moved out of its consolidation phase.
Relative Strength vs. Nifty: Turned positive, indicating outperformance.
Moving Averages: Closed above the 200MA and currently trading above all major EMAs, reinforcing the bullish sentiment.
Trading Plan:
📌 Entry: Above ₹1,400 (confirmation of breakout)
📌 Stop Loss (Short-Term): Below ₹1,350 (closing basis)
📌 Stop Loss (Positional/Long-Term): ₹1,160
📌 Target Levels: ₹1,500 - ₹1,600+ in the coming weeks
Final Thoughts:
With strong volume confirmation, technical strength, and positive relative performance, CHOLAFIN is well-positioned for an upward move. Adding this to my watchlist and monitoring for sustained momentum above ₹1,400.

Hindustan Zinc (HZL) Breakout: Is This the Start of a Big Rally?Hindustan Zinc Limited (HZL), established in 1966, is a leading Indian mining and resources company specializing in the production of zinc, lead, silver, and cadmium. As a subsidiary of Vedanta Limited, Hindustan Zinc holds a dominant position in the Indian zinc market, commanding approximately a 75% share.
Financial Performance:
In the quarter ending September 30, 2024, HZL reported a net profit of ₹23.27 billion, marking a 35% increase from the previous quarter.
This growth is attributed to higher zinc prices driven by increased demand from China and global supply concerns.
Revenue from silver, its second-largest business segment, increased by 20% during the same period.
Stock Performance & Trends:
On October 30, 2024, Hindustan Zinc reached a high of ₹575.
The stock later declined, hitting a low of ₹414.70 on January 13, 2025.
As of now, the price has recovered to ₹468, indicating a moderate rebound from its recent low.
Technical Analysis:
Falling Wedge Breakout: In the daily time frame, the price formed a falling wedge pattern, which has now given a breakout confirmation.
Strong Price Action on Feb 5th:
Price surged by 6.99% on February 5, 2025, signaling bullish momentum.
This was accompanied by a significant volume increase of 3.71M, compared to the last 30-day average volume of 1.3M.
The volume increased by approximately 185.38%, confirming strong buying interest.
Key Reversal Zone:
If the price faces rejection from the current level (LTP ₹468), a potential reversal zone lies between ₹432 to ₹443.90.
Resistance Levels:
Resistance 1: ₹500
Resistance 2: ₹553
Resistance 3: ₹630
Strategic Initiatives:
HZL is actively pursuing a transition to renewable energy, with plans to power its operations entirely through renewables within the next five to seven years.
This initiative aligns with India's broader strategy to reduce greenhouse gas emissions and increase the share of non-fossil fuels in electricity generation.
Ownership & Divestment:
The Indian government, which holds a 29.54% stake in HZL, announced plans to sell a 2.5% stake valued at approximately $634 million in November 2024.
Earlier in 2024, Vedanta sold a 3.3% stake in the company.
Conclusion:
Hindustan Zinc Limited remains a fundamentally strong company, benefiting from global metal demand and a steady dividend policy. However, recent stock fluctuations and technical patterns suggest strong bullish potential following the falling wedge breakout and volume surge. Traders should watch the ₹432-₹443.90 reversal zone if a pullback occurs, while ₹500, ₹553, and ₹630 serve as key resistance levels for further upside.

BIOCONKey Observations:
Cup and Handle Pattern:
The chart displays a classic cup and handle formation, which is a bullish continuation pattern.
The breakout above the resistance level confirms this pattern.
Volume Confirmation:
The breakout is supported by very high volume, which adds credibility to the move and suggests strong buying interest.
Resistance Turned Support:
The previous resistance around ₹380-₹385 is now likely to act as a support level in case of a pullback.
Trend Analysis:
The stock has transitioned from a downtrend into an accumulation phase and is now showing signs of an uptrend with the breakout.
Bullish Momentum:
A strong bullish candle breaking above the resistance indicates continued upward momentum.
Future Prospects:
Bullish Scenario:
If the breakout sustains, the stock could see a move toward ₹410–₹430 levels, which would be the next potential resistance zones based on historical price action.
The cup and handle pattern also suggests a medium-term bullish trend with a target derived from the height of the pattern.
Support Levels:
The immediate support lies around ₹380. If the stock pulls back, holding above this level would confirm the breakout and provide an opportunity for accumulation.
Bearish Scenario:
Failure to sustain above ₹385 could lead to a retest of lower support levels, around ₹360–₹370. However, this seems less likely given the strong volume on the breakout.
Key Risk Factors:
Broader market conditions or sector-specific news could influence the stock negatively, despite the bullish technicals.
Conclusion:
The chart shows a strong bullish setup with a confirmed breakout from a cup and handle pattern. The stock has the potential to reach new highs if it sustains above the breakout level. Traders and investors should monitor the price action and volume in the coming sessions for confirmation and watch for any signs of pullbacks or weakness.

Morepen Lab Near Key Support – Big Move Ahead?Morepen Laboratories (NSE: MOREPENLAB) - A Critical Technical Setup
In-Depth Chart Analysis
1. Descending Trendline Resistance:
• The stock is moving within a descending triangle pattern, with a clear downward trendline acting as resistance since the peak around ₹120.
• Currently, the stock is approaching this trendline near ₹80. A breakout above this level, supported by strong volume, could trigger bullish momentum.
2. Key Moving Averages:
• 200-Day EMA (Exponential Moving Average): The 200-day EMA is positioned at ₹69.66, which serves as a critical long-term support. The stock has tested this level multiple times, indicating its importance.
• The price is hovering slightly above the EMA, suggesting the stock is at a decisive point for trend confirmation.
3. Support Levels:
• ₹69.66: Immediate support lies here, aligning with the 200-day EMA. If this level holds, the stock could see a bounce toward higher resistance levels.
• ₹65.00 and ₹55.00: If the stock fails to hold ₹69.66, it could slide to ₹65.00, a psychological support, and then to ₹55.00, which marks a previous consolidation zone.
4. Resistance Levels:
• ₹80.00: The descending trendline converges with this resistance. A breakout above ₹80.00 could open the path to ₹95.00.
• ₹95.00: A crucial horizontal resistance zone. Beyond this, ₹115.00 could be the next major target.
5. Volume Profile:
• Recent volume spikes near support levels suggest accumulation by long-term investors.
• Watch for increasing volume during any breakout above ₹80.00, which would confirm strong buying interest.
6. Bollinger Bands:
• The price is trading near the lower Bollinger Band, indicating oversold conditions.
• A rebound toward the middle or upper band could align with a breakout above the ₹80.00 resistance.
7. RSI (Relative Strength Index):
• The RSI is nearing the oversold zone, typically a precursor to a potential reversal.
8. Symmetrical Triangle Formation:
• The stock’s current price action within a triangle pattern indicates consolidation. A breakout above the upper trendline or a breakdown below the lower support will dictate the next directional move.
Possible Scenarios:
Bullish Scenario:
• A breakout above ₹80.00 with high volume can propel the stock to test ₹95.00 in the short term.
• Sustaining above ₹95.00 could lead to a rally toward ₹115.00, marking a significant reversal of the bearish trend.
Bearish Scenario:
• A breakdown below ₹69.66 would indicate the continuation of the descending triangle, leading to lower levels like ₹65.00 and ₹55.00.
• Increased selling pressure or market weakness could exacerbate the downside.
About Morepen Laboratories
Company Overview:
Morepen Laboratories is a pharmaceutical and healthcare company specializing in Active Pharmaceutical Ingredients (APIs), formulations, and diagnostics. With a strong domestic presence and growing exports, the company’s key products include Loratadine (an anti-allergic API) and well-known OTC brands like Burnol and Dr. Morepen.
Financial Highlights:
• Revenue: The company has demonstrated consistent revenue growth, driven by exports and rising healthcare demand in India.
• Margins: Operating margins are moderate, with scope for improvement as exports scale up.
• Debt Levels: A low debt-to-equity ratio reflects strong financial stability.
• Cash Flow: Positive operating cash flow highlights effective financial management.
Growth Drivers:
1. Increasing demand for APIs globally, especially in regulated markets.
2. Expansion into diagnostics and OTC segments, with a focus on high-margin products.
3. Government incentives under the “Make in India” initiative for the pharmaceutical sector.
4. Investment in R&D to create niche formulations and increase market penetration.
Conclusion:
The stock is at a pivotal technical and fundamental point. A decisive breakout above ₹80.00 could signal the start of a bullish trend, while a breakdown below ₹69.66 might lead to further downside.
Disclaimer:
This analysis is for educational purposes only and does not constitute financial advice. Please conduct your own research and consult a certified financial advisor before making investment decisions.

Sundaram Finance Ltd. Chart Analysis The technical analysis of **Sundaram Finance Ltd.** using multiple indicators and features, including **Heikin Ashi candles**, **ATR trailing stops**, **support and resistance levels**, and various oscillators like **MACD** and **RSI**. Here is a detailed breakdown of the key observations:
---
### **1. Price Action and Trend Analysis**
- **Heikin Ashi Candles**:
- The green candles indicate an uptrend, and the red candles indicate a downtrend.
- There is a visible **falling wedge pattern** highlighted during the recent downtrend. A falling wedge is typically a **bullish reversal pattern**, which aligns with the price breakout seen at the end of the wedge.
- **Support and Resistance Levels**:
- Key resistance: Marked in purple (₹5,535.85).
- Key support: Marked in blue (₹3,732.90). The price seems to have tested this support level during the recent downtrend and rebounded.
- **ATR Trailing Stops**:
- The red and green trailing stop lines show dynamic support and resistance. The price has shifted above the green ATR line, indicating a bullish reversal.
---
### **2. Volume Analysis**
- **Volume Spike Indicator**:
- The histogram shows increasing green bars during the upward movement, suggesting strong buying momentum.
---
### **3. MACD Indicator**
- **MACD Lines**:
- The blue and red lines represent the MACD and Signal lines, respectively.
- The bearish divergence marked earlier (when the price made higher highs but MACD made lower highs) indicates weakening bullish momentum, which led to the correction.
- The MACD histogram has turned positive again, signaling a bullish crossover and renewed upward momentum.
---
### **4. RSI (Relative Strength Index)**
- **RSI Lines**:
- The green line represents the RSI value (38.03 currently).
- RSI is moving upwards from the oversold zone, which suggests a possible reversal in the trend.
- Breaking above the midline (50) will further confirm bullish strength.
---
### **5. Pattern Highlight**
- **Falling Wedge**:
- The falling wedge is a strong reversal pattern, and its breakout suggests potential upward movement.
- The breakout is supported by rising volume, adding strength to the pattern.
---
### **Key Insights and Forecast**
1. **Bullish Signs**:
- Price has broken out of the falling wedge pattern with strong volume.
- MACD bullish crossover and RSI moving out of oversold zones support a positive outlook.
2. **Resistance Levels**:
- Immediate resistance at ₹4,450 (marked by ATR and prior consolidation zone).
- Major resistance at ₹5,535.85.
3. **Support Levels**:
- ₹3,732.90 remains a strong support.
4. **Caution**:
- Watch for any pullback towards the support zone, especially if volume weakens or RSI fails to break 50.
---
### **Trading Strategy**
- **Long Position**:
- Enter on a retest of ₹4,000-₹4,100 zone (if confirmed with bullish candles).
- Target 1: ₹4,450 | Target 2: ₹5,535.
- Stop-loss: ₹3,700.
- **Short-term Momentum**:
- Monitor for MACD histogram and RSI strength to sustain.

Swing1.Current Price: The stock is trading at ₹307.35, up ₹9.45 (3.17%) for the day.
Trendline Breakout:
A downward sloping trendline (orange line) connecting recent lower highs was broken on the upside. This indicates a potential trend reversal to the upside.
Resistance and Support:
Resistance: The stock has crossed the immediate resistance level of ₹302 (blue line). Sustaining above this level could signal further bullishness.
Support: A key support zone is visible at ₹266.65 (orange horizontal line), which acted as a strong floor during pullbacks.
2. Volume Analysis
The volume at the bottom of the chart indicates significant participation during the breakout. Increased volume during an upward move confirms the strength of the breakout.
3. Candlestick Pattern
Recent bullish candles with higher closes and increased volumes signal strong buying interest.
There is no major bearish candlestick that would currently negate the breakout.
4. Possible Scenarios
Bullish Case:
If the stock sustains above ₹302, it can aim for higher targets, with next resistances possibly in the ₹320-330 range based on past price levels.
Positive sentiment in the defense sector, along with Bharat Electronics' leadership in electronic and defense equipment manufacturing, supports the bullish case.
Bearish Case:
If the stock fails to sustain above ₹302, it could revisit support levels near ₹266, which is a critical level for bulls to defend.
5. Conclusion
This chart suggests that BEL has entered a bullish phase after breaking out of its consolidation and downtrend. The breakout above ₹302, supported by strong volumes, indicates a higher probability of an upward trend continuation. Short-term traders can watch for further confirmation of the breakout, while long-term investors might consider accumulating on dips given the company’s strong fundamentals in the defense sector.
